Can a Research Paper or Essay Have Pictures or Images: Tips

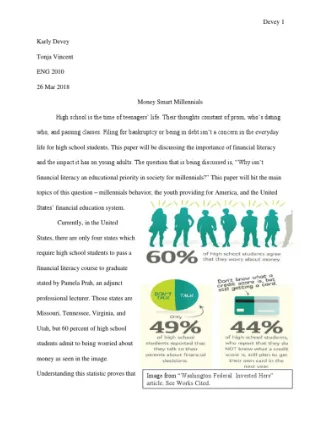
If you are writing a research paper, does it require pictures? Many academic papers are full of nothing but text. However, if your professor wants you to include images in your research paper, you might wonder if that is just for appearances or practical reasons.
The visual component can greatly improve the value and credibility of your work. If you have a large number of images and graphics that contribute to your whole research project, chances are they are going to include plenty of charts and graphs. Read on for more insight.
Can a Research Paper Have Pictures?
A research paper can have pictures if they help in reinforcing an argument or illustrating the idea that one is presenting. However, inserting pictures in an essay can be tasking and needs to formatted within the guidelines of your faculty. In addition, they should follow the referencing style being used.
At the same time, inserting pictures depends on the format of the paper such as the margin and the alignment of the paper. It also depends on the type research paper you are writing.
As a result of such variations and factors, many different types of papers use images in one way or another.

As for research papers, many different kinds of documents fall under this category.
Some papers require visual aids to make their point, while others do not.
For example, a paper that seeks to prove that a certain event happened would require evidence, perhaps including images of places or people involved in the event. Other papers may not require images at all.
The bottom line is that whether you can include images in your paper depends on the kind of paper you are writing and what information you want to convey.
If you want to show something visually, an image might be appropriate for your paper. If you wish only to describe something using words, no image is needed.
A picture’s worth a thousand words, they say. If it is relevant, a graphical depiction of data may be just what your readers need to understand your findings. But do not just slap a chart or graph into your paper and call it a day. It needs to stand on its own and provide context for the research it illustrates.
When Pictures Improve a Research Paper
A research article with pictures can grab a reader’s attention, who may not have time to read an entire research paper. A picture can be worth a thousand words in capturing readers’ attention.

If you are writing a research paper that includes pictures, make sure they are integrated into the flow of your paper.
Pictures can serve as excellent supporting evidence for your topic, but make sure you focus on your topic and maintain the point you want to make in the body of your paper.
If you decide to use a picture or other illustration, make sure it is high quality and captures the essence of your topic.
Pictures can capture your reader’s attention, but they must also support or enhance your topic or main point.
How to Insert Pictures in a Research Paper
A good picture can help readers understand what you are writing about and make your paper more interesting. There are several ways to design a research paper with pictures.
1. Use the Right-Justification Method
This method is convenient to insert single pictures in APA-style papers. Place the cursor where you want the picture to show up and click on Insert, then Picture to find the picture you want to add. Click on OK and then click on the image.
Right-click on it and click on Format Picture, then select Layout. Under Layout, select In Line with Text, and then under Position, select Right. This will place your image on the right side of your paper and allow you to write text next to it.
2. Use the Center Method
You can also center images by placing your cursor at the beginning of a new line. Click on Insert, then Picture, find the picture you want to insert and click OK.
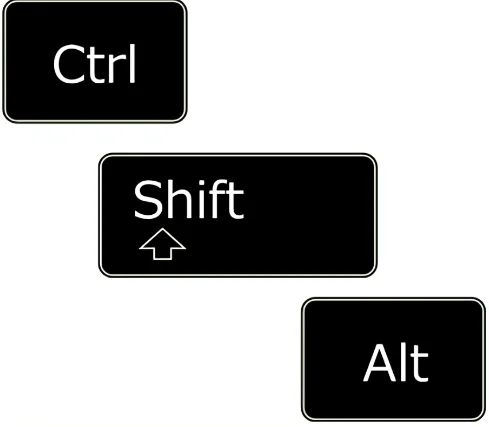
Click on the picture and right-click on it while holding down Shift+Ctrl+Alt keys together until a gray box appears around your image.
Click on Format Picture and select Layout. Under Layout, select In Line with Text, and under Position, select Center.

This will center your image in a paragraph of its own so that there is no text above or below
Here are some points that may help you insert pictures in a research paper:
- The image should be of good quality and must not be blurred.
- The picture should be placed such that it is the highlight of the paper.
- The picture should be properly framed and provided with a caption to look more appealing.
- While inserting pictures, care should be taken regarding the copyright and other permissions required, if any.
How to Insert the Following into a Research Paper
1. Graphics
a. Insert a graphic or figure into the document. If you have created the graphics, you can insert them as an object or picture. If you are inserting an image from a file, use the Insert menu select Picture and From File. Find the image in your files and insert it.
b. Format the figure caption: Choose Format menu, Caption command (or right-click on the graphic, choose Caption).
In the Caption dialog box, choose Figure (because it is a graphic) in the Label box; type a caption text that briefly describes what is shown in the graphic; click Numbering to apply automatic numbering to your captions.
You can also choose Position to place your caption below or above your graphic (or you can put it inline). When finished, click OK.

c. Place your cursor after the caption and press Enter twice to create one blank line between the graphic and its caption and another blank line between the caption and any following text. This will allow space for page breaks within your document if needed.
d. Insert cross-references: If you have more than one figure in your paper and need to refer to it from another location in your paper (say in a results section), you can insert a cross-reference.
2. Charts
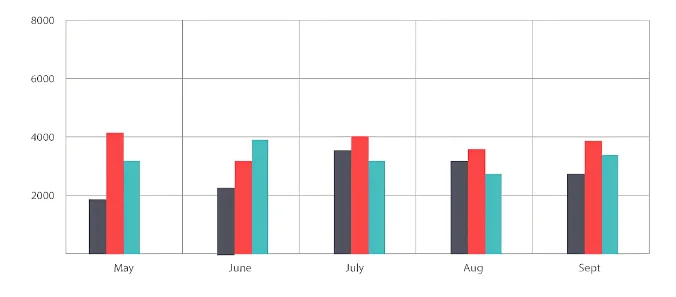
Charts and diagrams work to improve your paper’s readability and visual appeal. They are especially useful in papers that discuss complex subjects.
Microsoft Word makes it easy to add these elements to your document, and you can modify them at any time if they don’t look quite right.
a. Open the document in Microsoft Word in which you want to insert a chart or diagram. Click the “Insert” tab at the top of the screen and click “Chart.”
A list of chart types will appear on the left side of the screen. Click on one of the types to see an example of that type of chart on the right side of the screen.
b. Click on a chart type that you want to use for your document, then click “OK.” A window will open with sample data for your chart.
You can either add your data in this window or import it from Excel or another program later. You can also change the chart type after it has been inserted into your document if you later decide that you want to use a different chart style.
3. Graphs
You can also use these steps to insert graphs from Microsoft Excel into your PowerPoint slides:
Step 1: Open the graph you want to insert in an Excel spreadsheet. If you have not yet created your graph, create it now.
Step 2: Click on the graph to select it. Double click on one of its borders if you need to adjust its size or shape.
Step 3: Press control-c (or go to the Edit menu and choose Copy) to copy the graph onto your computer’s clipboard.
Step 4: Open up Microsoft Word, and go where you want the graph inserted. Put your cursor right at that spot, then press control-v (or go to the Edit menu and choose Paste). Your graph will now be in your document!


