- Have your assignments done by seasoned writers. 24/7. Contact us:
- +1 (213) 221-0069
- [email protected]
Does Turnitin Check Graphs and Tables? Here is how to escape
Do you have a paper that you need to submit through Turnitin, but you are worried about a graph or a table that you copied? Well, it is a common concern, but just know it does not check everything. While there is a limit to what is scanned, it is always a question to know if Turnitin really checks and detects copied graphs or tables.
It is sometimes interesting to know what exactly is detected by the Turnitin software as far as graphics are concerned. But you can check our fast essay help if you do not want to worry about Turnitin scans.

Let us explore this issue in depth and know the tips you can use to format your graphs and tables better for Turnitin.
Does Turnitin check Graphs and Tables?
Ideally, Turnitin does not check graphs and tables if they are placed in a Word file as graphical images. This is because such graphs are not highlightable text. However, Turnitin will detect the text in the graphs or tables if they are created using a Word file or Excel and presented as highlightable text in its scanning software.
It should be noted that Turnitin checks text content only. This content is stored in the Turnitin database and constitutes students’ work, books, journals, articles, and web pages.
While Turnitin may not check or detect infographics, it is good to note that most tables on a paper have highlightable content and can be detected if you copy-paste. The same applies to any content in a paper with tables and graphics.
To understand the issue of graphs and tables as it pertains to Turnitin plagiarism scans, let’s explore the types of graphs that can be detected or not.
Type of Graphs or Tables Turnitin can Detect
1. Highlight-able graphs and tables
Graphs that can be highlighted are not so different from text. Turnitin can compare them with other highlightable graphs on its database.
Graphs with text that can be highlighted are likely to be detected by Turnitin. The text is checked for similarity by Turnitin, and if there are any matching texts, the graph will be flagged as plagiarized.
2. Graphs made by Excel
All graphs made by Excel must be well understood by Turnitin for it to check similarity. Most graphs made by Microsoft Excel are detectable by Turnitin. Avoid using Excel in OpenOffice or LibreOffice.
Only single Excel graph files with no link to separate Excel files will be detected. To ensure that Turnitin accepts your Excel graph, do not hide sheets, rows, or columns.
You should also ensure that you use a document inspector to check for any available issues in your graph that may make it unacceptable.
Type of Graphs and Tables Turnitin cannot Detect
Image or Picture Graphs and Tables
Turnitin is not able to check plagiarism in any type of image. It cannot detect the correct text from images and so does not support image upload.

Graph images that are in documents will be available on the similarity reports but will not have been checked for plagiarism.
It’s not only Turnitin, but also many software cannot detect characters from an image correctly.
However, Optical Character Recognition is under massive development in the recent past.
They are optimistic that soon enough, software there will be able to detect characters in images.
If this works, all cheats and image copy-pastes will be caught by Turnitin.
PDF Graphs
As long as the text in the Pdf graphs is not highlightable, then Turnitin will not be able to access it. Pdf graphs that contain image portfolios, files, and files also are unlikely to be accepted by Turnitin.
Pdf graphs with multiple files in them also will not be detected. Any pdf graph that is made by another software apart from Adobe will also not be detected after being checked by Turnitin.
Infographics and Tables Pasted from the Internet
Turnitin does not detect graphs mostly from the internet, especially if they are in jpeg or PDF formats or just pasted into a Word document as a picture. However, copying graphs that can be detected, such as graphs made by Excel, is risking being caught.
This is because its database will not contain graphs from internet pages. You can, therefore, copy graphs from the internet and escape being noticed by Turnitin.
How to Copy Tables to Escape Turnitin
You can copy graphs that cannot be detected by Turnitin directly without changing anything if you copy them within the right format. Since we determined Turnitin cannot detect images, you can copy your tables as an image and effectively plagiarize without being caught.
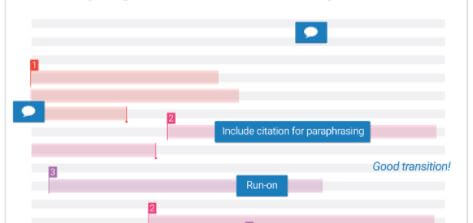
For graphs and tables with highlightable text, you need to increase their originality. Some of the ways we advise how to cheat Turnitin by reducing the similarity include paraphrasing, changing structure, and using synonyms when copying to avoid being caught by Turnitin.
Claiming undetectable work as your own is plagiarism. Instructors who may have come across them may easily identify them. Consider using citations to escape plagiarism in such circumstances.
Tips on how to use Graphs well in Essays
Graphs are a form of visual format that helps you represent numbers well when you have a lot of them to share with your readers. Graphs help readers understand paragraphs that consist of dense information more efficiently.
You can use several types of graphs in essays as follows:
1. Use line Graph
Use a line graph to display data over a certain period. If you want to present the earnings of a company in half a year, you can use a line graph.
If the earnings are of more than one company, then you will have to use more lines.
A single line should represent a single company. These graphs, as usual, have both the x-axis and the y-axis.
2. Get x and y Axis Right
The passage of time is represented by the x-axis, while the data measures are represented by the y-axis. The scale in these graphs does not need to start at zero necessarily. The axes do not need to show potential numbers because these graphs need to show relevant data only.
3. Fill the numbers carefully
It is important to usually fill the numbers along both axes very carefully. This will make you understand the data represented completely. Bar graphs are used to demonstrate similarities and differences among different categories at a singular time.
For example, if you want to show how customers rate different products, you will have to use a bar graph. Just like the line graphs, these graphs also use the x-axis and the y-axis.
4. Axis as baselines
The x-axis should serve as the baseline for bars because the passage of time is not being recorded. The y-axis does not necessarily need to begin or end at a certain number.
5. Label the bars
Label the bars correctly to enable the reader to understand the data correctly. Place the range of numbers appropriately for your graph to represent data correctly.
How to Format Graphs and Tables in an Essay
Different writing formats have different methods of formatting graphs.
Formatting your graph with APA
- Text
The font size of the texts in graphs should range from eight to twelve. Only san serif fonts should be used.
- Sizing
Top and bottom margins should not be exceeded by the height of figures.
One column figures must range from 2 and 3.25 inches. A range of 4.25 and 6.875 should be followed in two-column figures.
- Line graphs
Maintaining the font size of other labels use squares and circles to differentiate line graph curves.
- Alignment
Though there is no exact specification for these, graphs should be close to their referenced texts. Graphs should always be referenced as “Figure.”
- Titles and labels
There should be no titles within the graph except in research papers. But you can name a graph using a caption below it. All figures must be numbered.
Format your graph with MLA
- Labeling
Graphs are usually labeled “figure or fig.” “Figure or Fig” should be capitalized. If they are many, you must include an Arabic numeral that corresponds to the figure.
- Title
In note form after labeling, include the title or caption of the graph below it.
- Alignment
There is no specific alignment required in MLA. Place figures near texts that reference them. Without capitalizing, reference the figure using “figure:”
- The Text
The font in the rest of your paper should be the font used in your graphs text. Is should be between 8 and 14.
Best software to Draw Graphs for your Essay
SmartDraw to make Graphs
Even without expertise in Excel SmartDraw will help you make graphs. You will start with a graph template in which you will add your information, apply themes, and thereafter export it to your preferred destination.
SmartDraw is considered one of the best graph drawing software because of its intelligent formatting, the quickly provided start template, and free customer care support.
Gnuplot for drawing Graphs
Gnuplot is a well-established graphing tool that is mostly used by intermediate and advanced users. It visualizes mathematical data and function. Gnuplot is available for Linux, Windows, and Mac.
The software has advanced over the years to help visually display all types of scientific data. Documentations, advice, and tutorials on how to use this program are available online.
SigmaPlot Graph Maker
SigmaPlot has brought the real revolution when it comes to drawing graphs. It consists of several resources that ensure your satisfaction once you decide to use it. You can easily select and change properties.
Changes are immediately graphed, and you can view them easily. You can easily edit your work and show it off precisely and clearly. With SigmaPlot, you can easily access data from spreadsheets, integrate data from Microsoft Word, and easily present your results on Microsoft PowerPoint.
In a nutshell, SigmaPlot ensures you produce graphs of very high quality without sitting in front of your computer for hours. With this, you can create good graphs and avoid worrying if Turnitin can check graphs since you will have stopped copying from the internet.
To learn more, watch the video here